← Complex Geometry & Info Modelling
02
SNAM
Complex Geometry & Info Modelling — Energy Infrastructure Existing Network
Overview
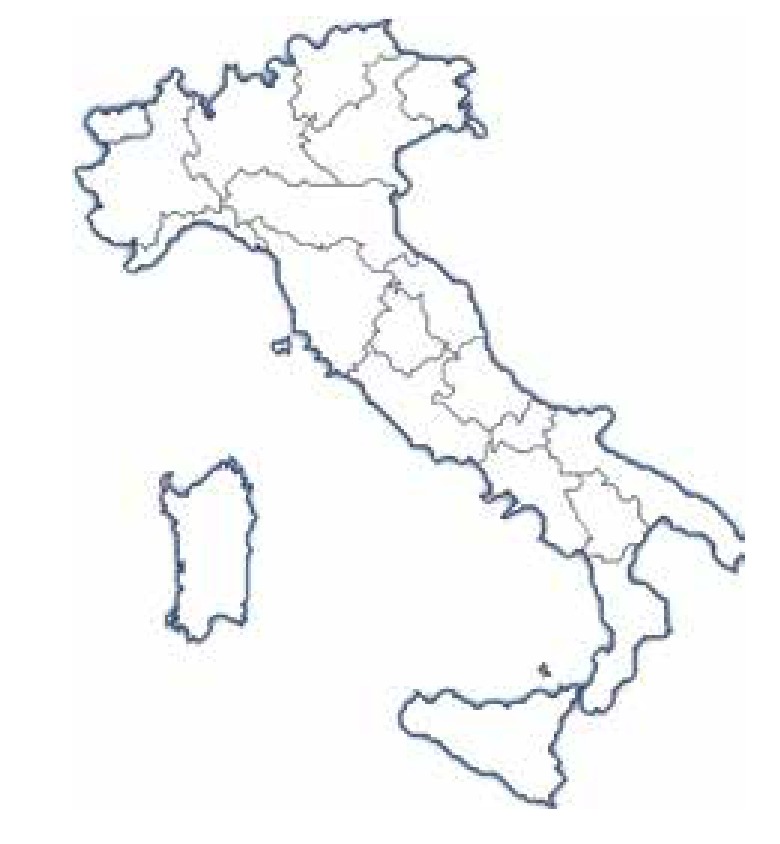
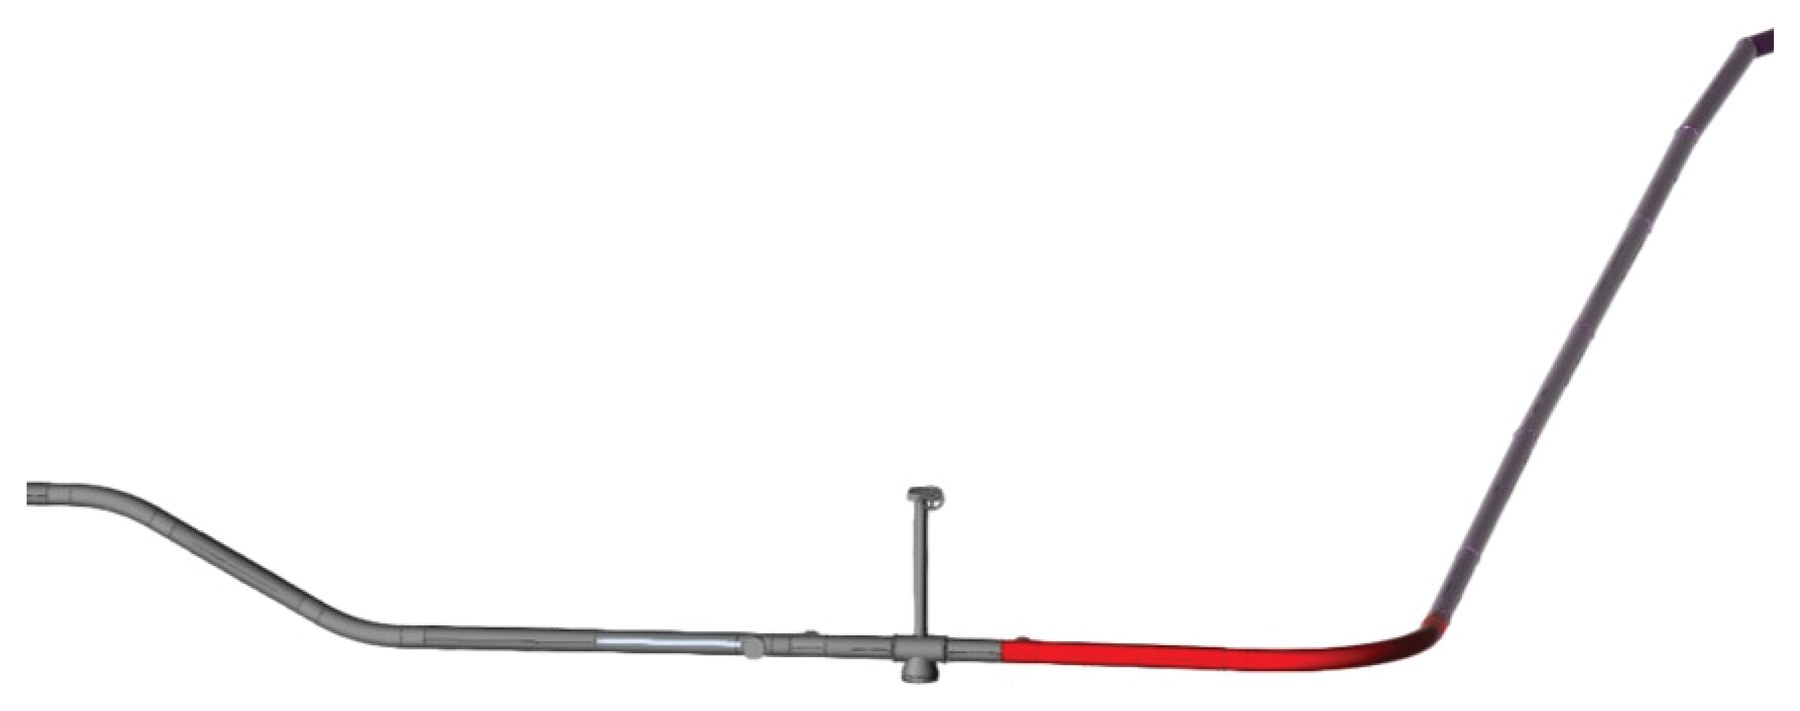
SNAM's national gas network held decades of as-built pipeline records in raw spreadsheet form — thousands of coordinate points naming the pipe (BARR) and elbow (CURV) fittings that make up each route, with no direct path into a Revit model. The brief was to convert that dataset into an actual, buildable Revit model of the pipeline network.
From Coordinates to Model
An algorithm built in Grasshopper — driven through a Human UI front end and written back into Revit via Rhino.Inside.Revit — organises the recorded points by coordinate, works out which elbow connects which pipe segment, and reconstructs the route element by element. In the ideal case, that's the whole job: coordinates in, a coordinated Revit model out.
Where Real Data Breaks the Ideal Case
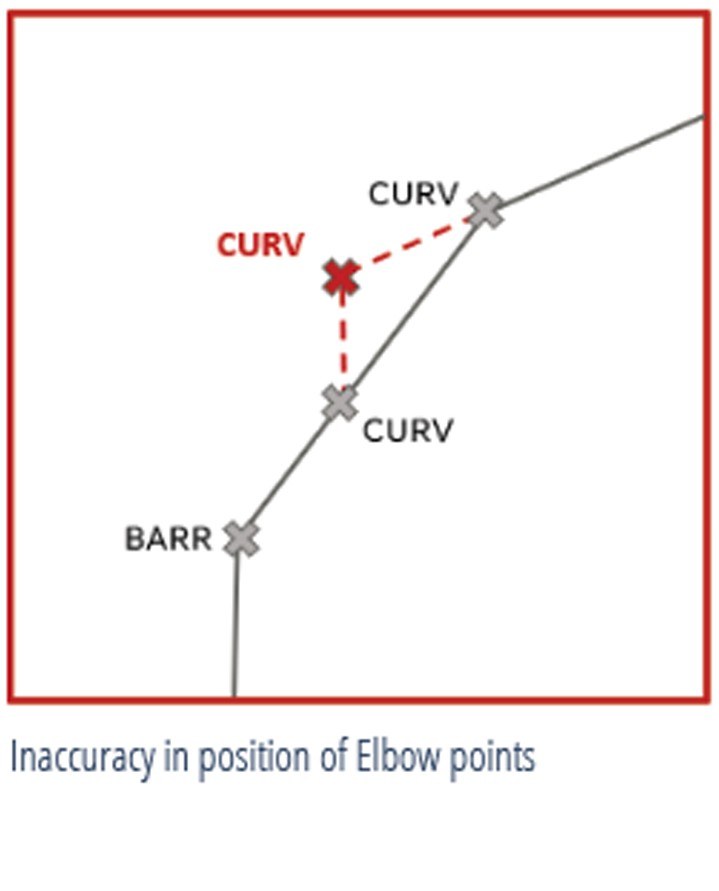
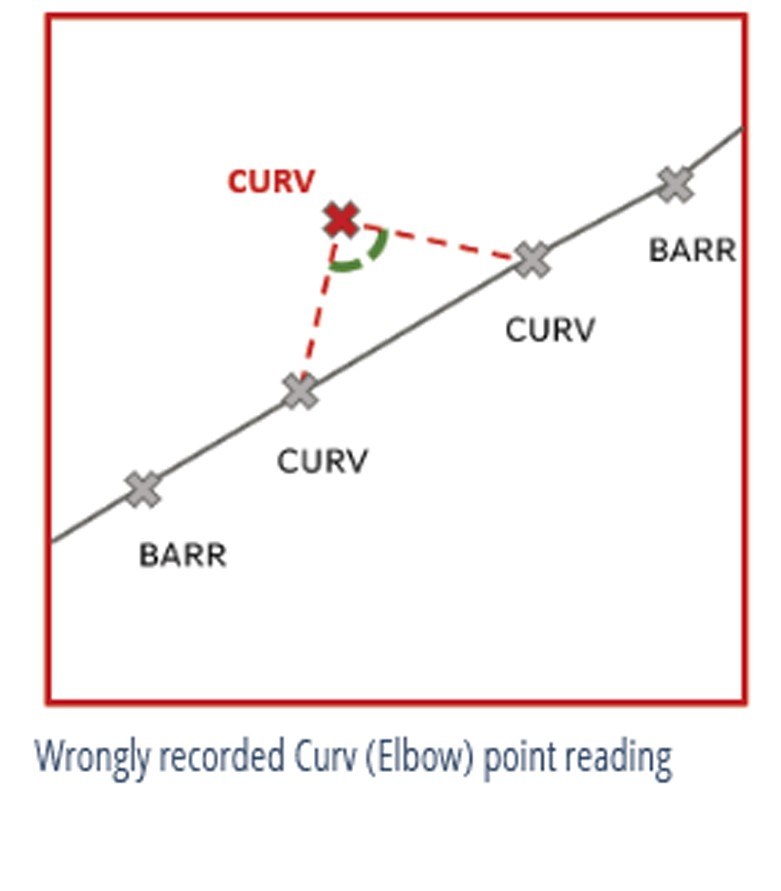
Practical implementation rarely stayed that clean. Field records carried human recording errors and measurement-tool inaccuracies, so the script had to be rewritten and adapted to anticipate and approximate them rather than fail on them — starting with elbow points whose recorded position didn't match the route.
Missing and Conflicting Records
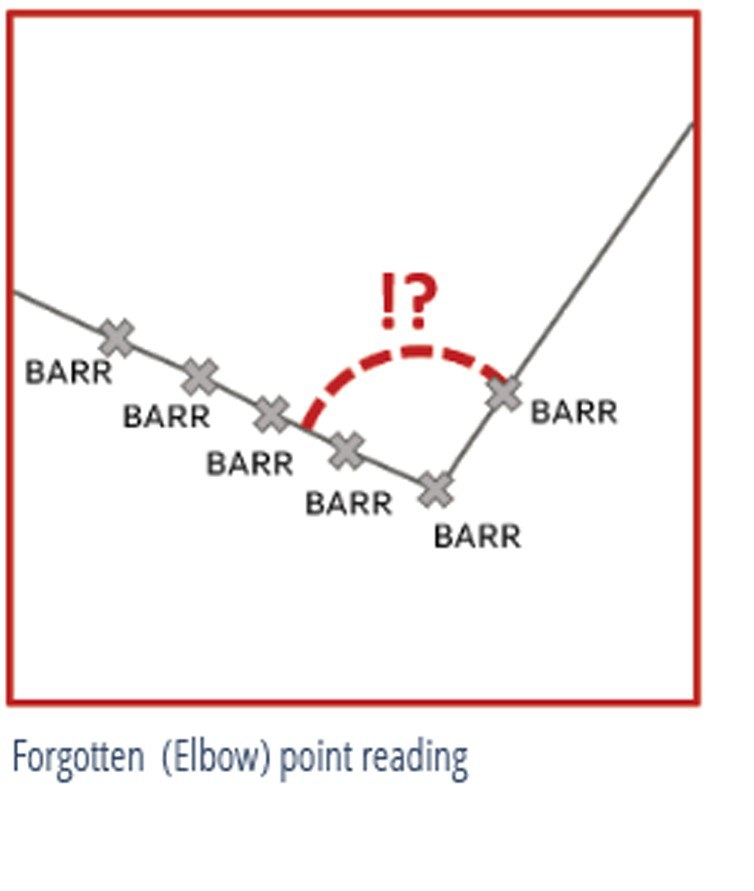
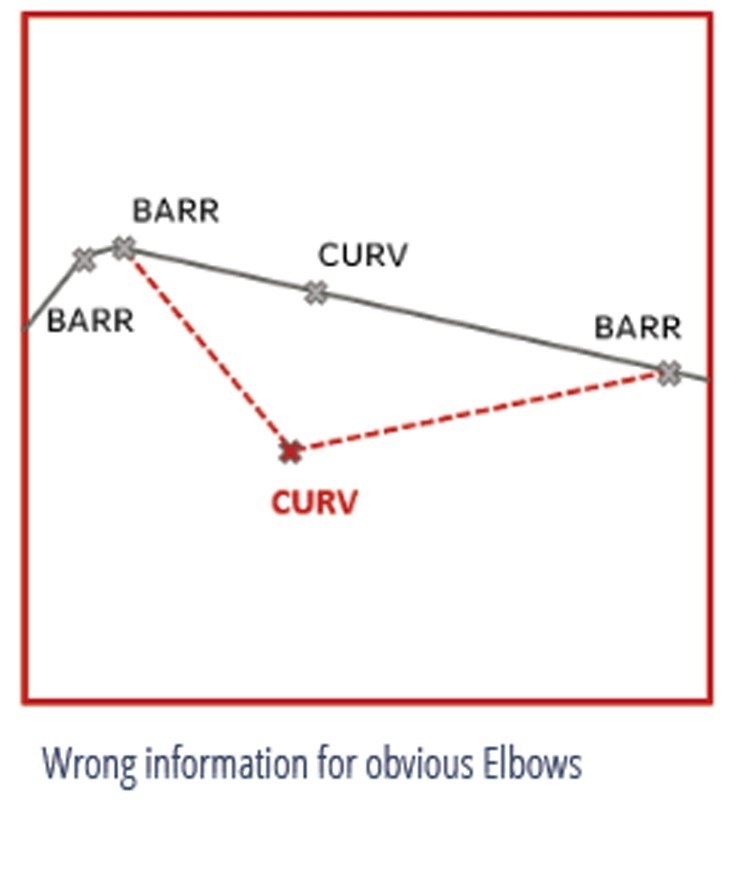
Other gaps were more basic: an elbow the geometry clearly needed had no reading logged for it at all, or the logged reading contradicted what the route was actually doing. The script had to flag these cases rather than silently build a wrong pipeline.